
Is Your Bookkeeping & Accounting Giving You Data or Information?
Seeing is believing – or so I am told.

Numbers, spreadsheets, and financial reports have long been the domain of accountants, leaving non-accountants feeling lost in a sea of confusion. But fear not! The presentation of accounting information is starting to become sexy, again.
If you are like most people, you have trouble staring at columns of numbers and seeing the big picture. The industry has fallen behind and needs to simplify the data and create visualizations and information that anyone can understand.
Even the simplest information, if not presented clearly, might go unnoticed. It’s all about presentation and delivery. At Sanitas Accounting, our mission is to help make actionable information out of accounting data.
Let’s dig into the benefits of making accounting numbers digestible for non-accountants and how it unlocks a world of business insights.
Break Down Information Barriers
Let’s face it: accounting jargon can feel like an alien language. Words like “EBITDA”, “accrual” and “amortization” might as well be gibberish to non-accountants. To confuse matters more, accountants may not always agree on the definitions of accounting terms. It’s little surprise that accountants find themselves alone at cocktail parties.
The terminology and jargon are barriers for owners and operators to overcome and sometimes it’s embarrassing to ask about definitions. Simplifying accounting numbers and terms helps unravel the mystery and empower everyone to comprehend financial reports and break down the barriers.
Decisions Made Easy
Accounting isn’t just for number-crunchers. Managers, marketers, engineers—everyone needs financial insights to make informed decisions. Without a clear understanding of the financial insights, stakeholders are flying blind or operating without a full understanding of what’s happening in the business and their area
By presenting simplified accounting numbers, we arm non-accountants with the power to understand the financial implications of their actions. Spotting trends, identifying anomalies, and evaluating the impact on the bottom line become second nature for non-accountants. They can have the knowledge to ask intelligent questions and actively engage in financial discussions.
Presenting information that is accessible makes for an inclusive decision-making process where everyone has a seat at the table. Think about the benefits and improved conversation and decision making process your organization can have with a better informed team.

Win Over Your Investors

Investors are important stakeholders and may be key to growth and success.
To win them over, transparency is key. Simplified numbers help create a crystal-clear narrative that resonates with investors. While investors might understand large spreadsheets and financial jargon, why open yourself up to going down rabbit holes on esoteric terms and definitions that distract from the bigger picture?
Instead, presenting financial information in a format that even your grandma could understand allows investors to see the forest from the trees. Transparent, accessible reports build trust, attract investments, and can help your business thrive.
Your results visualized will show investors that you are on top of your KPI’s and tracking performance closely. Presenting clear and easy to understand numbers will separate you from the pack.
A study published in the Journal of Finance shows that confusing or hard to understand financial information raises a company’s cost of capital.
Learn Your Story Quicker & Free Up Time
Numbers alone can be as exciting as watching paint dry. A full page of numbers can also be incomprehensible to the non-numerically inclined. For leaders who like to dig in, they might spend quite a bit of time trying to understand and unravel the trends. The time spent reviewing and analyzing the numbers might be better spent on product, sales, or other areas of the business.
We think we have the solution!
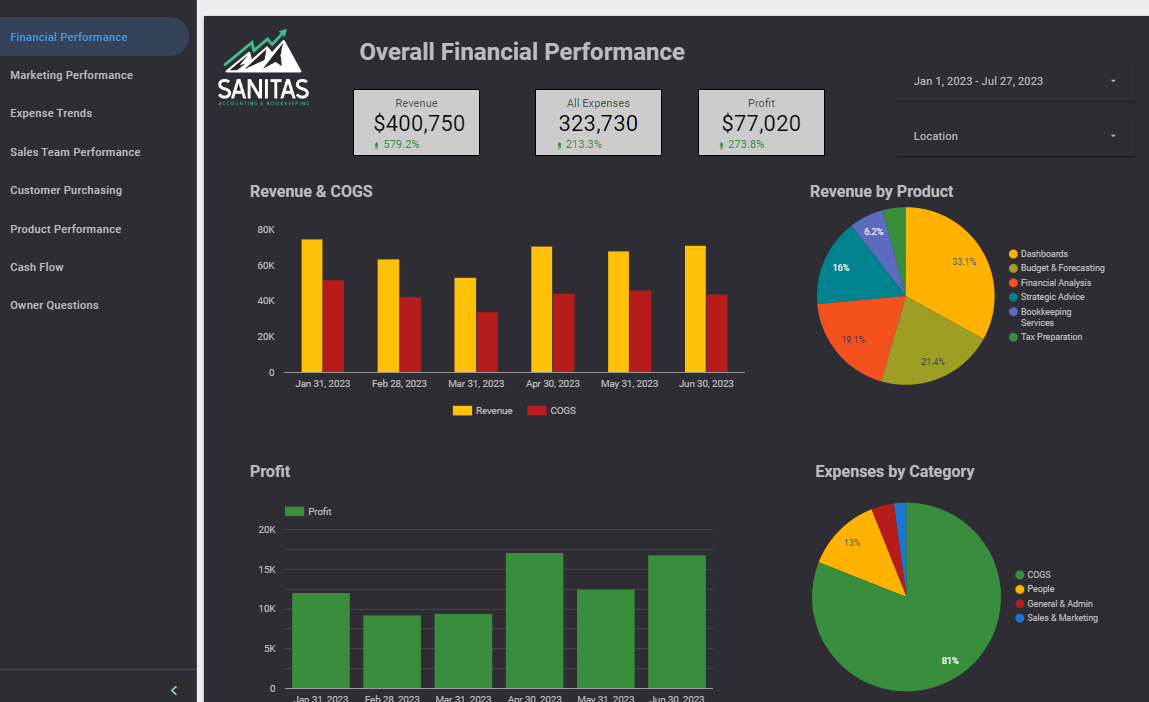
Visualizations transform dreary figures into captivating visuals packed with information. Our charts, graphs, and infographics bring data to life, allowing non-accountants to spot trends, compare performance, and unravel the financial story behind the numbers.

Simple Visuals Often Do The Job
Don’t let perfect be the enemy of good enough. Start small and expand.

While fancy interactive dashboards that update automatically and allow users to toggle between different variables like time periods, locations, and products are great, sometimes simple and easy-to-build visuals are equally useful and powerful. One recommendation we like to make is color coding variances for budget vs actual comparisons. By simply coloring good, better-than-expected variances green and bad, worse-than-expected variances red, end users can quickly identify and focus on areas of the business operating outside of expectations. Simpler is often better.
Simple usually means more people with an organization can apply the same techniques and special Excel, Tableau, PowerBI and other program expertise may not be required. Also, a transition to visualizing data can be accomplished incrementally and need not be all done at once. While we love the high powered, specialized tools, Sanitas Accounting knows sometimes perfect is the enemy of good enough. It’s usually better to have an imperfect something that clearly communicates results than a hypothetical future program that does not exist.
In our experience, we have seen many attempts at data visualization go wrong do to complex process requirements, difficulty selecting the right BI product, and questions about ownership over processing and maintaining the dashboards and database. BI projects can be expensive and time-consuming. As such, we recommend starting small and with something before agreeing towards more full scale and powerful products and implementations.
Wrapping Up
The days of accounting being intimidating, mysterious and incomprehensible might be coming to an end. Sanitas Accounting is bringing simplicity, accessibility, and visual flair to the world of accounting. By breaking down the barriers, presenting information in plain language, and incorporating engaging visualizations, our goal is to unlock the power of accounting for non-accountants.
Better decision-making, stakeholder buy-in, investor appeal, financial literacy, and captivating visuals are within reach. Join us in embracing our movement to make accounting more captivating and inclusive. Our recommendation is to start by visualizing some of your data. Start with simple charts and see whether and how conversations about the results change in your organization.
If you don’t know where to start, Sanitas Accounting can help. Reach out and we’d be happy to help with strategy and implementation on simplifying your accounting and adding visualization.


Contact us: SanitasAccounting.com or via LinkedIn
Proudly based out of Boulder, CO